
Quick answer: To make a report card in Excel, enter each student’s marks in a marks sheet. Calculate the total and the percentage (total ÷ maximum marks × 100), look up a grade from a grading scale, work out the rank with COUNTIF, and decide the result: pass if every subject is at or above the pass mark. Then pull one student’s row into a printable report card. The free Xplorexcel Report Card Generator does all of this for up to 60 students and 8 subjects: choose a roll number and the report card is ready to print.
Key takeaways
- One marks sheet for the whole class: theory and internal or practical marks for each subject.
- Total, percentage, grade, rank and result (Pass, Compartment or Fail) are calculated automatically.
- A printable A4 report card for any student: choose the roll number and print.
- An editable grading scale with grade points and remarks. The default is A1 to E.
- Class result analysis: subject-wise pass percentage, average, highest and lowest marks, grade distribution, toppers, and the students who need attention.

Report card format
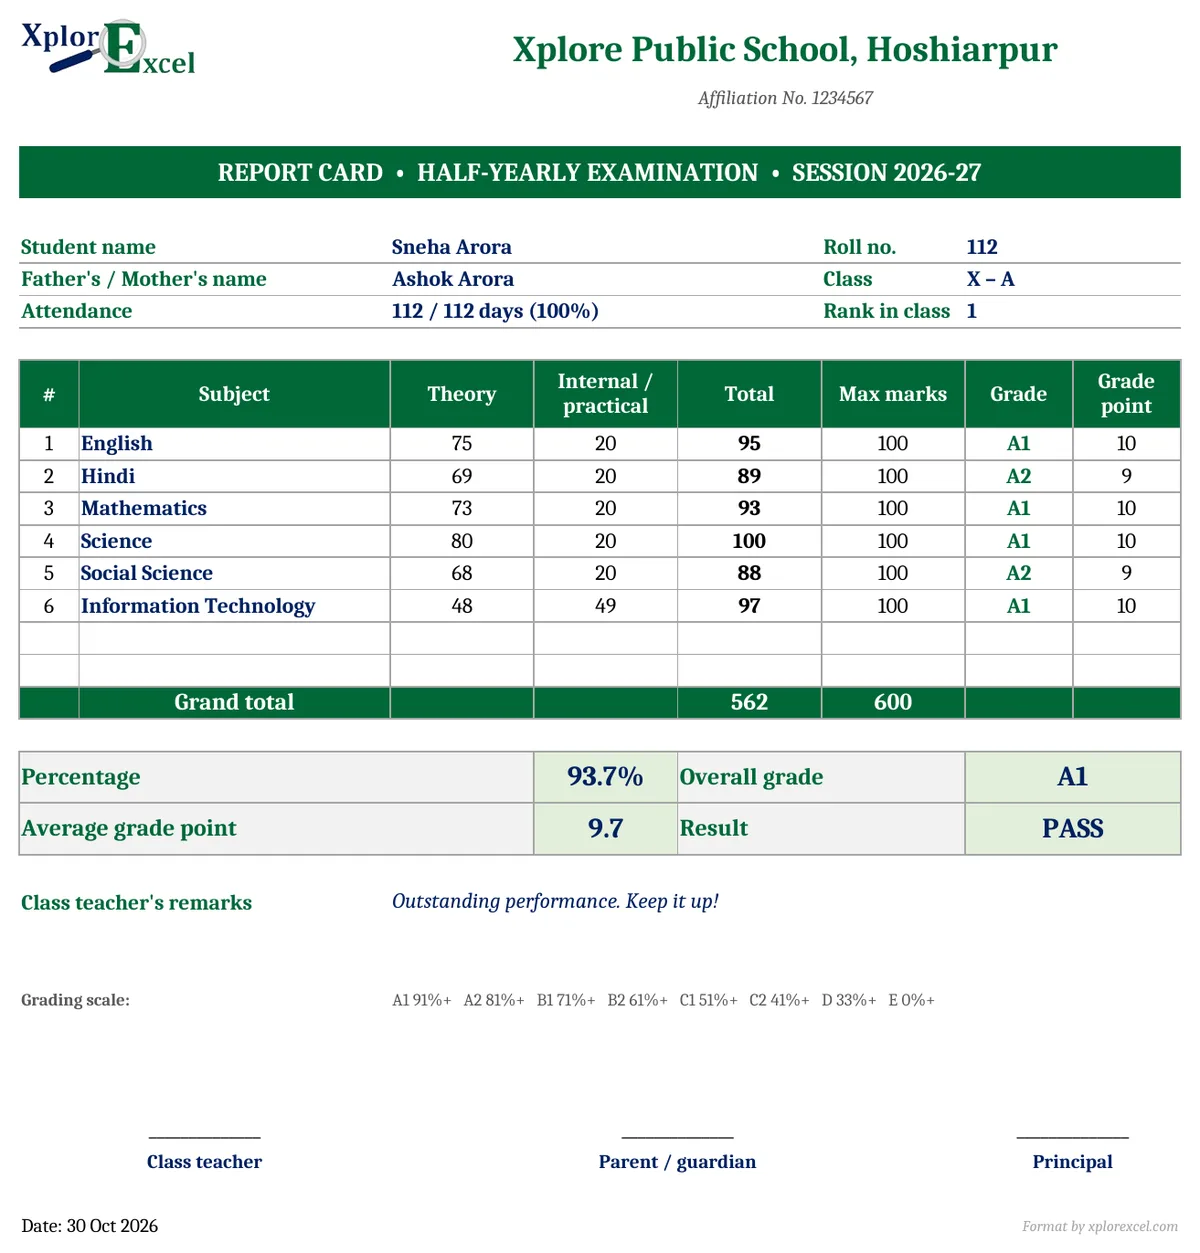
A school report card usually has four parts, and the template prints all of them on one A4 page:
- Header: school name, affiliation number, examination and session.
- Student details: name, parent’s name, roll number, class, attendance and rank.
- Marks table: for each subject, theory marks, internal or practical marks, total, maximum marks, grade and grade point.
- Summary: grand total, percentage, overall grade, average grade point, result, the class teacher’s remarks and signature lines.
Grading scale used (editable)
| Marks % | Grade | Grade point | Remark |
|---|---|---|---|
| 91 – 100 | A1 | 10 | Outstanding |
| 81 – 90 | A2 | 9 | Excellent |
| 71 – 80 | B1 | 8 | Very good |
| 61 – 70 | B2 | 7 | Good |
| 51 – 60 | C1 | 6 | Above average |
| 41 – 50 | C2 | 5 | Average |
| 33 – 40 | D | 4 | Satisfactory |
| Below 33 | E | 0 | Needs improvement |
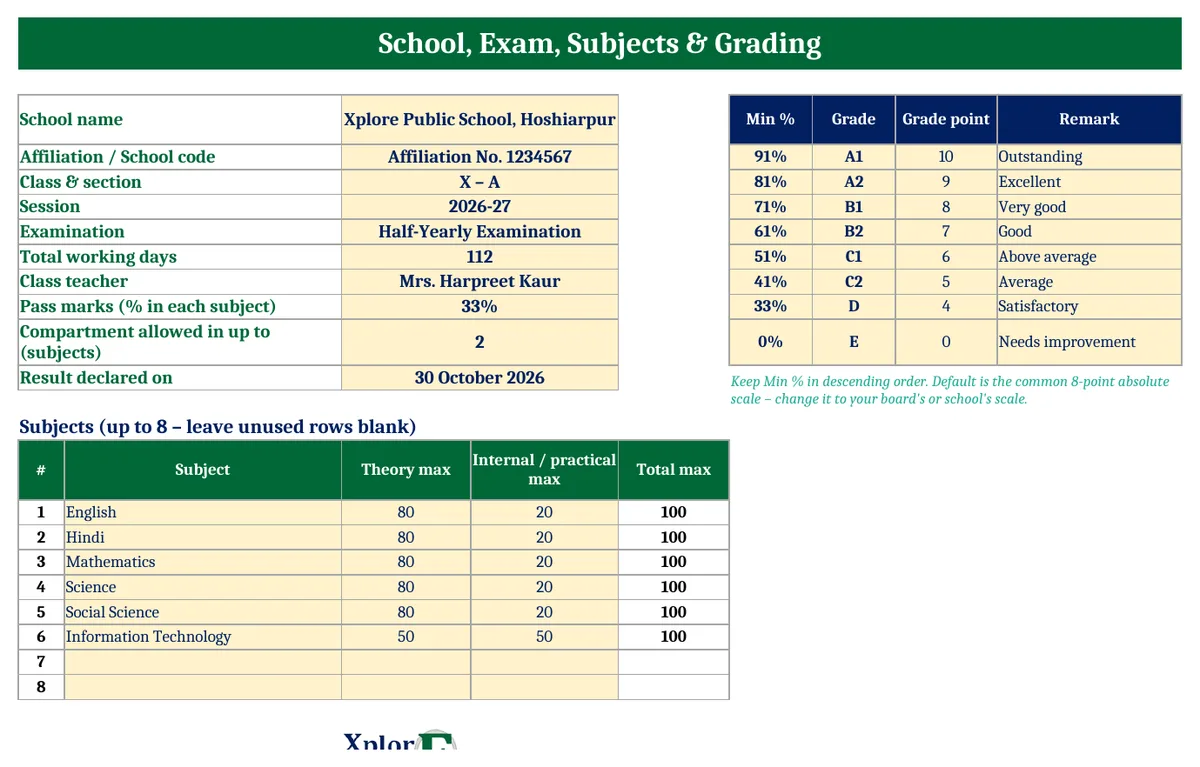
This is a common 8-point absolute scale. Boards and schools differ, so you can change the cut-offs, grades, grade points and remarks on the Setup sheet, and the whole workbook follows. The pass mark (33% by default) and the number of subjects in which a compartment is allowed (2 by default) are also settings.
Excel formulas behind the marks sheet
| Result | How it is worked out |
|---|---|
| Total | Sum of theory and internal marks in all subjects |
| Percentage | =Total / Max marks, formatted as % |
| Rank | =COUNTIF(Totals,">"&Total)+1, so equal totals share a rank |
| Grade | Looked up from the grading scale by percentage |
| Result | PASS if no subject is below the pass mark. COMPARTMENT if 1 or 2 subjects are below. FAIL if more |
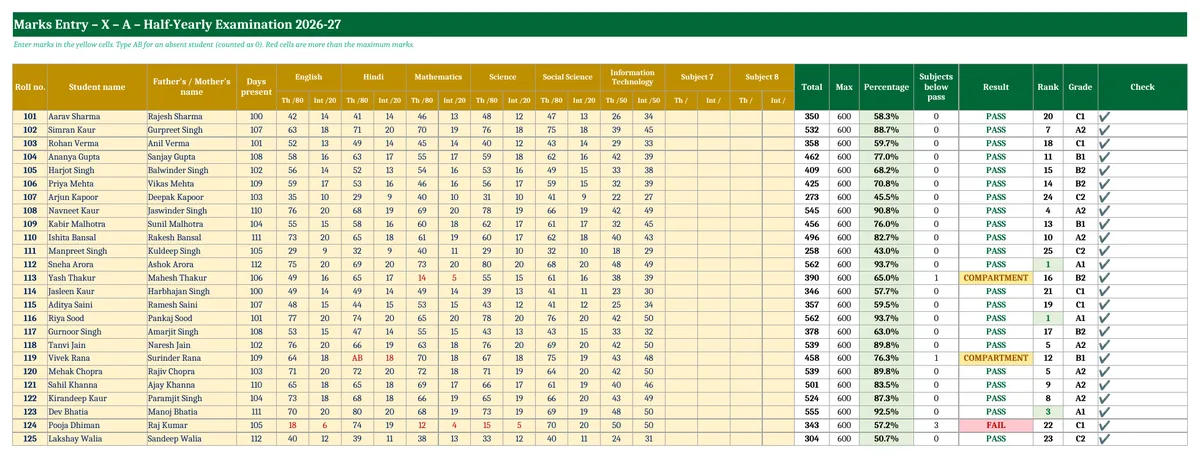
Type AB for an absent student. It counts as zero and shows on the report card. Marks above the maximum turn red, and the Check column flags duplicate or missing roll numbers.
Class result analysis
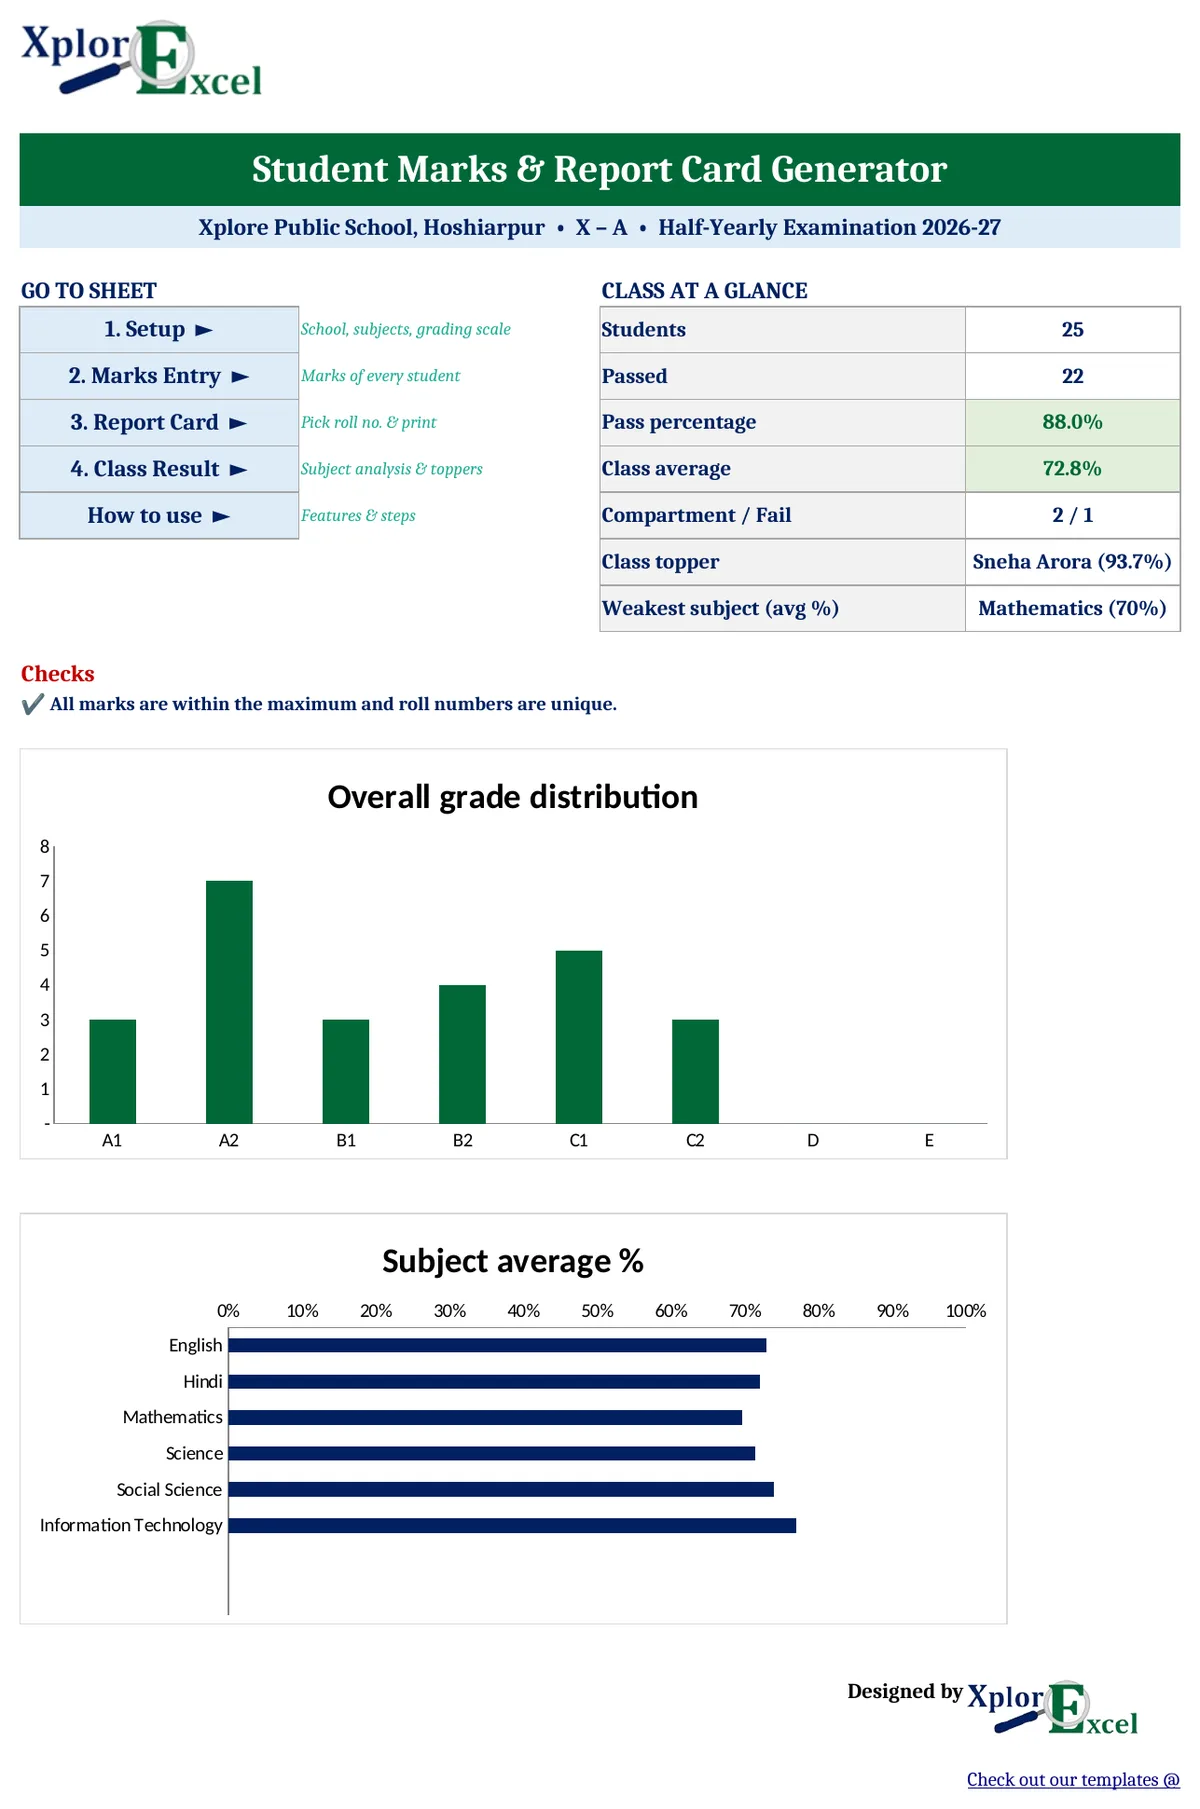
The Class Result sheet covers what a class teacher reports after every exam:
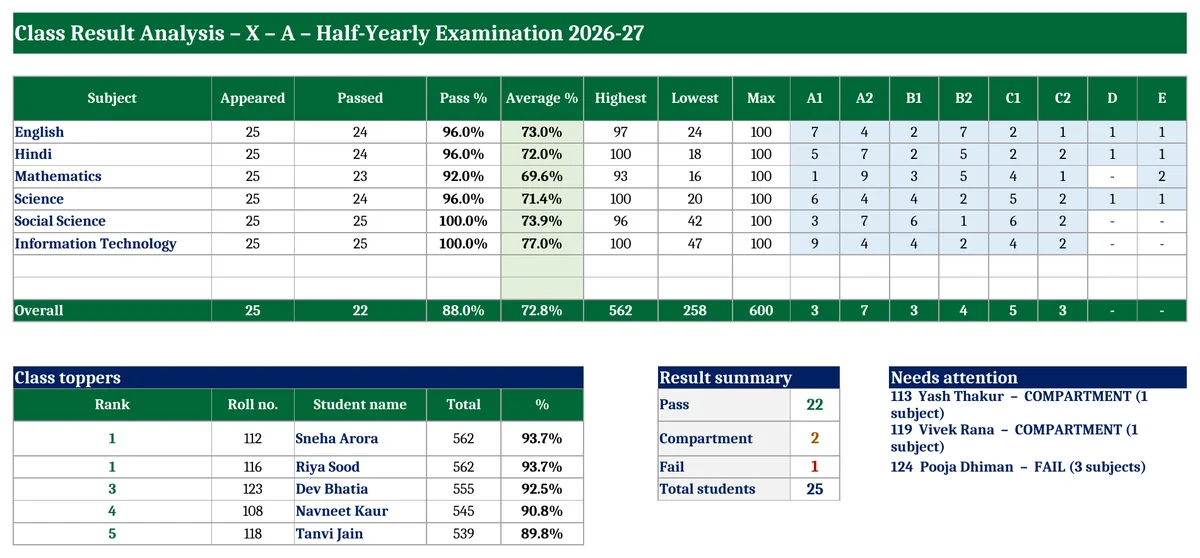
- For each subject: students appeared and passed, pass percentage, average, highest and lowest marks, and how many students got each grade.
- The overall pass percentage and class average.
- The top 5 students.
- Students with a compartment or fail result, and in how many subjects.
In the sample class of 25, 22 passed (88%), 2 got a compartment and 1 failed. Mathematics had the lowest average, at 69.6%.
How to make report cards in Excel (4 steps)
- Setup: Enter the school name, class, exam, session, working days, pass percentage, subjects with maximum marks, and your grading scale.
- Marks Entry: Add each student’s roll number, name, parent’s name, days present and marks.
- Report Card: Choose a roll number and print. Repeat for each student, or save each one as a PDF.
- Class Result: Review the subject analysis and share it with the principal.
Download the Report Card Generator in Excel (Free)
File: Student Marks and Report Card Generator 1.0 · Format: .xlsx · Macros: none · Price: free.
Get updates and new free templates
Your download below doesn’t need this. Leave your WhatsApp number or email and I’ll send you fixes for this file and new free templates. No spam, unsubscribe anytime.

The sample has 25 students and 6 subjects. Clear the yellow cells on Marks Entry and enter your own class.
Frequently asked questions
How do I make a marksheet in Excel?
Put the student names in rows and the subjects in columns. Add a Total column with SUM, a Percentage column (total ÷ maximum marks), a Grade column that looks up the percentage in a grading table, and a Rank column with COUNTIF. This template has all of these, plus a printable report card.
How do I calculate rank in Excel without sorting?
Use =COUNTIF($U$7:$U$66,">"&U7)+1. It counts how many students scored more and adds one. Students with equal marks share a rank, and the next rank is skipped (1, 1, 3).
How is the percentage calculated on a report card?
Percentage = total marks obtained ÷ total maximum marks × 100. For 562 out of 600, that is 93.67%.
What does compartment mean in the result?
It means the student is below the pass mark in a small number of subjects (usually one or two) and can take a supplementary or compartment exam in those subjects instead of repeating the year. You can set the limit on the Setup sheet.
Can I print report cards for all students at once?
The template prints one student at a time: change the roll number, then print or save as PDF. With a printer that keeps the print settings, a class of 40 takes only a few minutes.
Can I use this report card template in Google Sheets?
Yes. Upload the .xlsx file to Google Drive and open it with Google Sheets. It has no macros.
More free Excel templates and tutorials
- COUNTIF Function in Excel
- IF Function in Excel
- Attendance Sheet with Salary Calculation
- Employee Leave Tracker
- All Excel templates
The grading scale is an example. Follow your board’s or school’s rules. Last reviewed: October 2026.
