
Quick answer: A stock register records every item that comes into and goes out of stock, with a running balance. For an item, closing stock = opening stock + purchases (In) − sales or issues (Out). To value closing stock, Indian accounting (AS 2) allows two common cost formulas. FIFO (first in, first out) assumes the oldest stock is sold first, so closing stock is valued at the latest purchase rates. Weighted Average uses one average rate: (opening value + purchase value) ÷ (opening qty + purchased qty). The free Xplorexcel template keeps the stock register and values closing stock both ways automatically.
Key takeaways
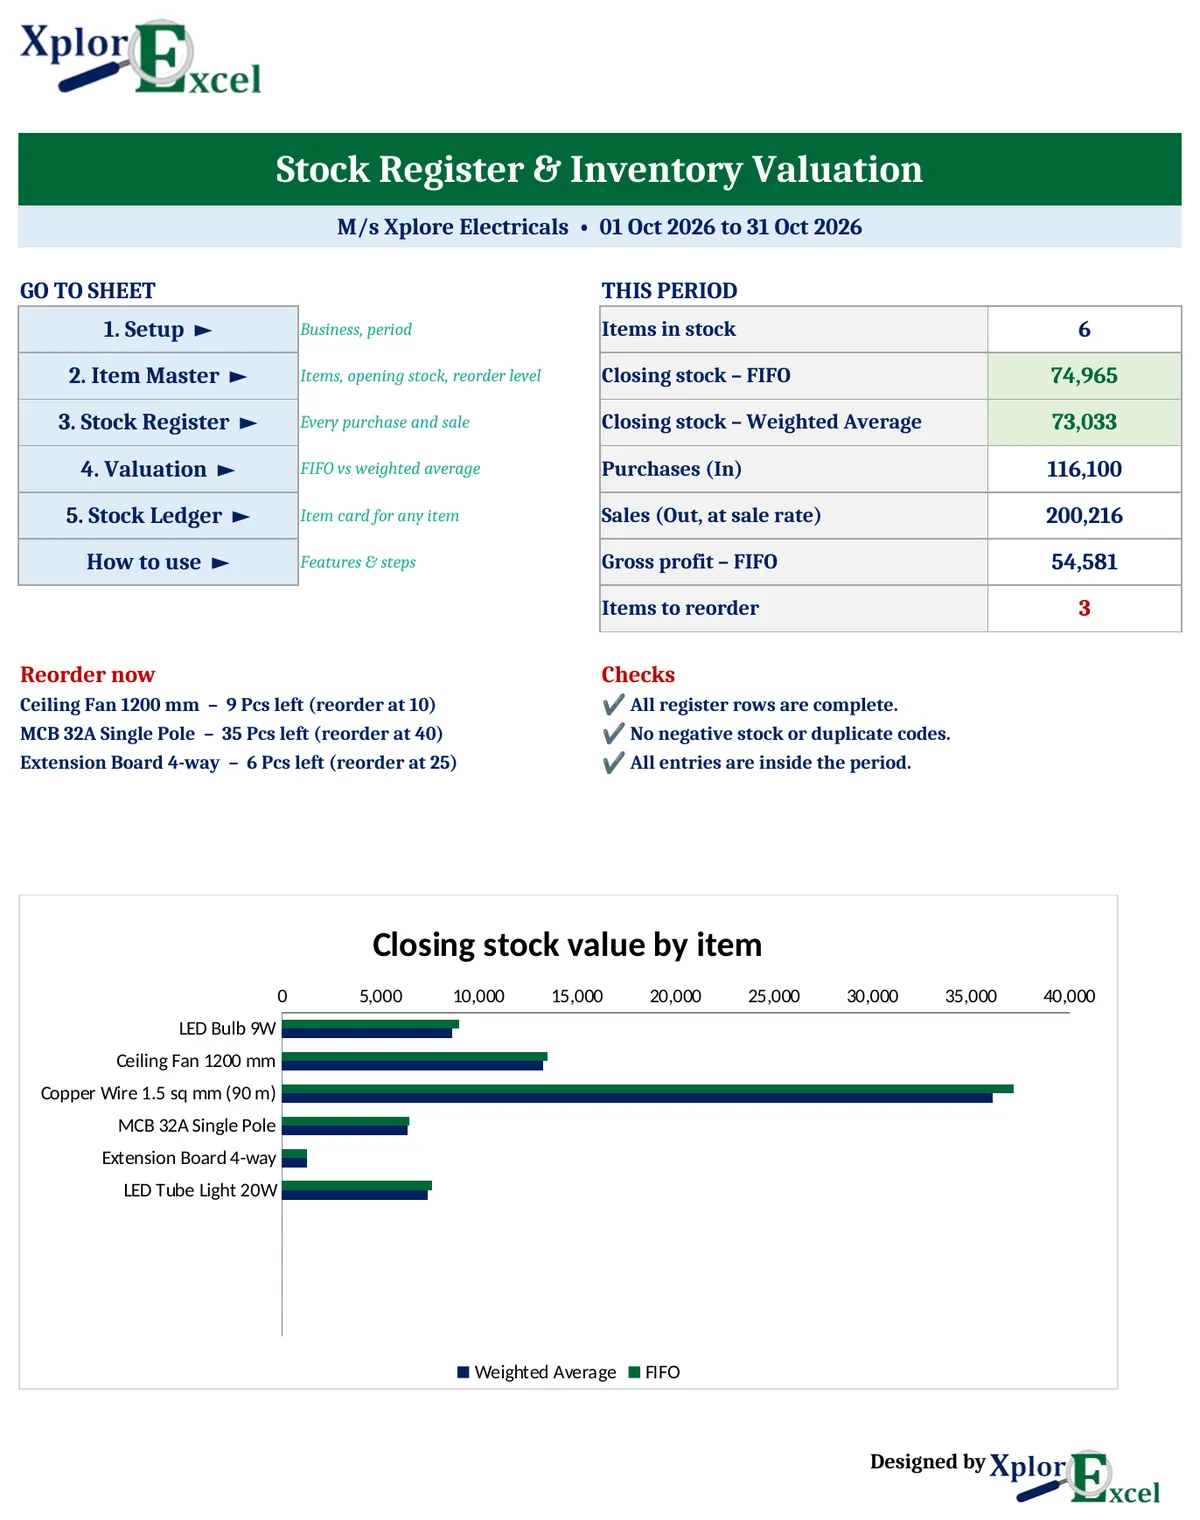
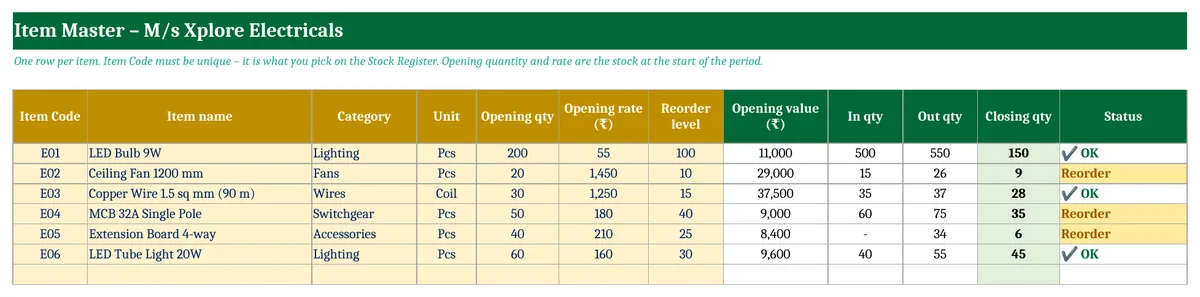
- An Item Master for up to 100 items, with unit, opening stock, opening rate and reorder level.
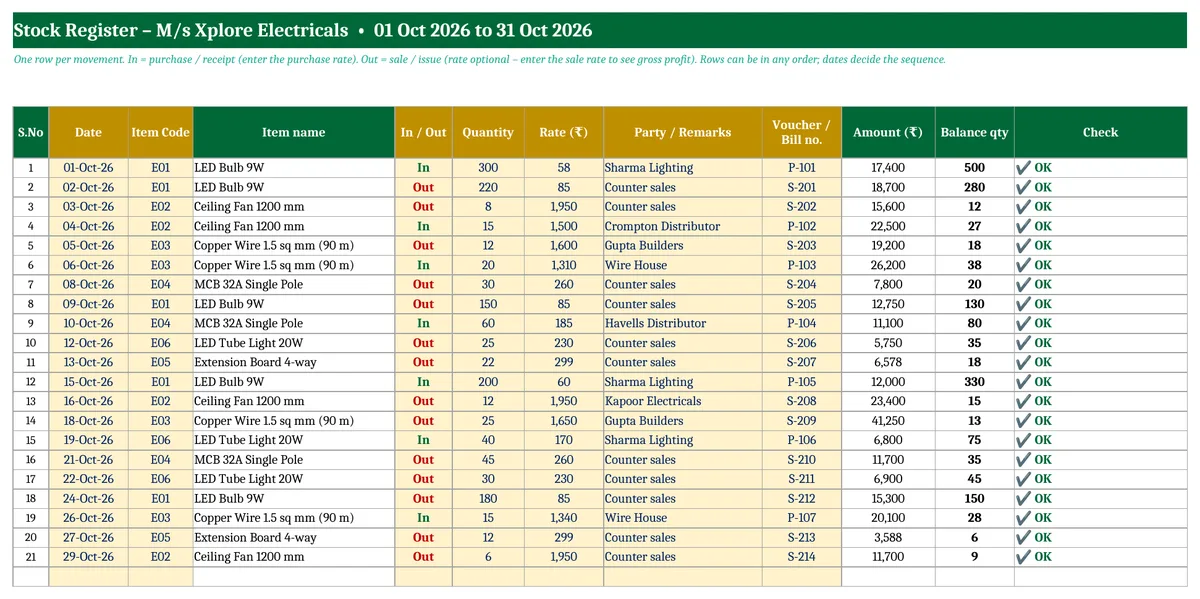
- A Stock Register for up to 500 purchases and sales, showing the running balance of each item. Entries can be in any order.
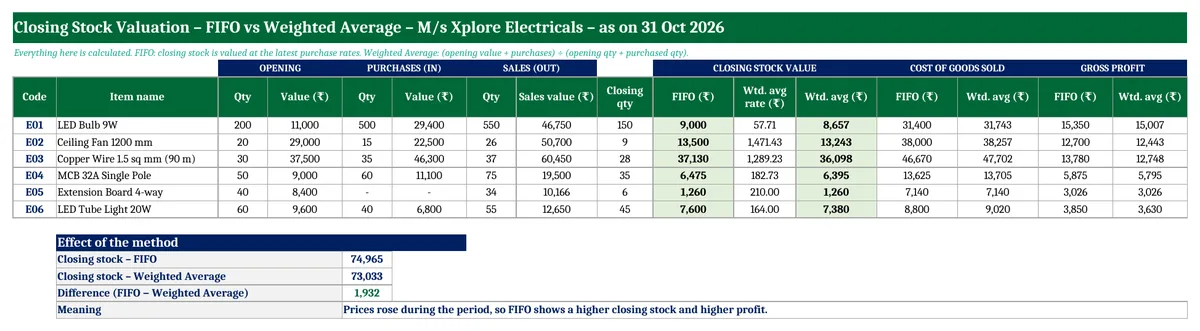
- Closing stock valued by FIFO and Weighted Average side by side, with cost of goods sold and gross profit under each method.
- A Stock Ledger (item card) for any item, plus reorder alerts on the dashboard.
- Checks for unknown item codes, missing rates, stock going negative and duplicate codes.
Stock register format
A stock register, also called a stock book or inventory register, has one line for each movement of goods:
| Column | What to enter |
|---|---|
| Date | Date of the purchase, sale or issue |
| Item code and name | Picked from the Item Master |
| In / Out | In for purchases and returns from customers. Out for sales, issues and returns to suppliers |
| Quantity and rate | Purchase rate for In. For Out the rate is optional: enter the sale rate to see gross profit |
| Party, voucher or bill no. | Supplier or customer, and the bill number for reference |
| Balance qty | Calculated: the item’s stock after this entry |
FIFO vs Weighted Average: how closing stock is valued
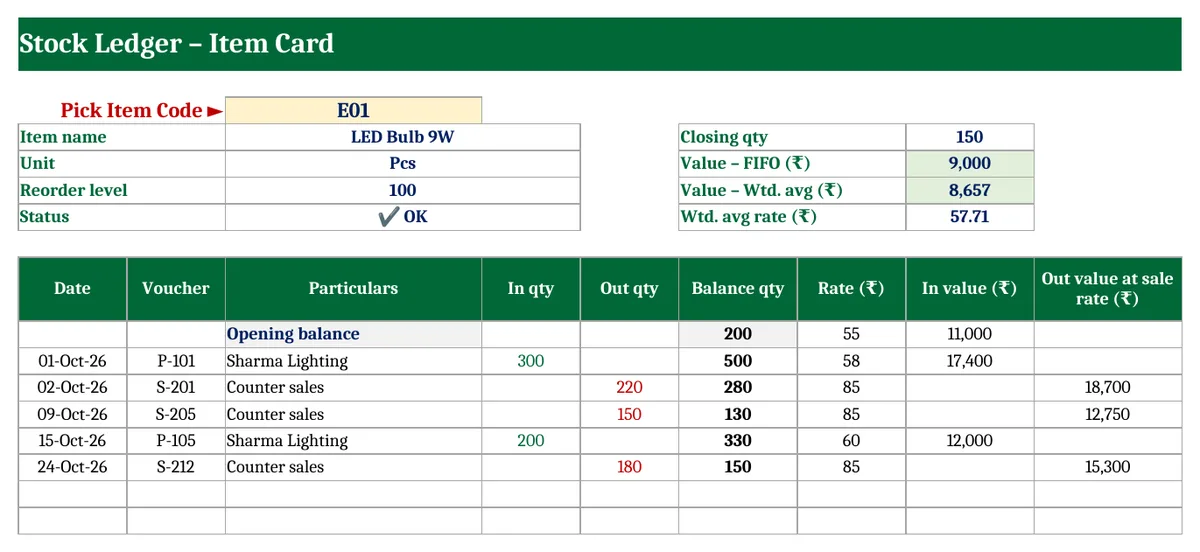
Here is the LED Bulb 9W from the sample file for October 2026:
| Date | Movement | Qty | Rate (₹) | Balance |
|---|---|---|---|---|
| 1 Oct | Opening stock | 200 | 55 | 200 |
| 1 Oct | Purchase | 300 | 58 | 500 |
| 2 Oct | Sale | 220 | 280 | |
| 9 Oct | Sale | 150 | 130 | |
| 15 Oct | Purchase | 200 | 60 | 330 |
| 24 Oct | Sale | 180 | 150 |
- FIFO: the 150 bulbs left are the most recent ones, all from the 15 October lot at ₹60, so closing stock is 150 × 60 = ₹9,000.
- Weighted Average: (11,000 + 29,400) ÷ (200 + 500) = ₹57.71 per bulb, so closing stock is 150 × 57.71 = ₹8,657.
When the remaining stock comes from more than one lot, FIFO uses each lot in turn, newest first. The copper wire’s closing stock of 28 coils is 15 coils from the latest lot at ₹1,340 plus 13 from the one before at ₹1,310, which is ₹37,130.
Why the method changes your profit
Cost of goods sold = opening stock + purchases − closing stock. A higher closing stock means a lower cost of goods sold and a higher profit. In the sample, prices rose during October, so FIFO gives a closing stock of ₹74,965 and Weighted Average gives ₹73,033. That makes gross profit ₹1,932 higher under FIFO. When prices fall, the effect reverses.
| FIFO | Weighted Average | |
|---|---|---|
| Closing stock is valued at | Latest purchase rates | The period’s average rate |
| When prices are rising | Higher stock, higher profit | Lower stock, lower profit |
| Best suited to | Perishable or dated goods, and businesses where old stock really does go out first | Identical goods mixed together, such as wire, grain or chemicals |
LIFO is not permitted under AS 2 or Ind AS 2. Whichever method you choose, use it consistently from year to year.
Stock ledger (item card)
Pick any item code on the Stock Ledger sheet to see its opening balance, every purchase and sale in date order, the running balance and the closing value under both methods. This is the format many auditors and banks ask for during stock audits.
Reorder level alerts
Set a reorder level for each item in the Item Master. When the closing quantity reaches that level, the item’s status changes to Reorder and it appears in the dashboard’s “Reorder now” list. A common way to set the level is average daily sales × supplier lead time in days, plus a safety margin.
How to maintain a stock register in Excel (4 steps)
- Setup: Enter the business name and the period. The last date of the period is the valuation date.
- Item Master: Add each item with its unit, opening quantity, opening rate and reorder level.
- Stock Register: Enter every purchase (In, with the rate) and every sale or issue (Out). Fix anything the Check column flags.
- Read the results: The Valuation sheet has the closing stock for your final accounts, and the Stock Ledger shows any item’s card.
Download the Stock Register in Excel (Free)
File: Stock Register and Inventory Valuation (FIFO / Weighted Average) 1.0 · Format: .xlsx · Macros: none · Price: free.
Free download · one quick step
Unlock this free template
This one is a full working system, not a one-page format. It stays free. I only ask for a way to reach you, because:
- It has several linked sheets with a filled-in sample, so you see it working before you type your own entries.
- The formulas are locked so one wrong click can’t break your totals. If something still goes wrong, you’ll know where to ask.
- Tax and labour rules change. When GST, TDS or payroll rules change, I send the corrected file to the number or email you give here.
- No spam. A few messages a month at most, unsubscribe any time.
Made by Amanpreet Kaur Bharaj, XplorExcel, Hoshiarpur. You only need to do this once on this device.
The sample has 6 items and 21 entries for an electrical shop. Replace them with your own items.
Frequently asked questions
What is the format of a stock register?
Date, item, quantity received, quantity issued or sold, balance quantity, rate and value, plus the supplier or customer and the bill number. Many businesses keep a separate page for each item, which is the stock ledger or item card. This template has both views.
How do you calculate closing stock using FIFO?
Work out the closing quantity, then value it at the most recent purchase rates, working backwards through the purchases until the closing quantity is covered. If 150 units remain and the last purchase was 200 units at ₹60, closing stock is 150 × ₹60 = ₹9,000.
How do you calculate the weighted average cost of inventory?
Divide the total of opening stock value and purchase value by the total of opening quantity and purchased quantity. Multiply that rate by the closing quantity to get closing stock.
Which method is better, FIFO or Weighted Average?
Neither is better in every case. FIFO suits goods that are sold in the order they were bought. Weighted Average suits identical goods that get mixed together. AS 2 allows both, but the method must be applied consistently.
Is closing stock always valued at cost?
No. Under AS 2, inventory is valued at cost or net realisable value, whichever is lower. If goods are damaged or their selling price has fallen below cost, write them down to net realisable value.
Can I use this stock register in Google Sheets?
Yes. Upload the .xlsx file to Google Drive and open it with Google Sheets. It has no macros.
More free business templates from Xplorexcel
- Inventory Management Template
- Purchase Order Format with GST
- GST Invoice Format in Excel
- Trading and Profit and Loss Account Format
- All Excel templates
Last reviewed: October 2026.
